

.webp)

.svg)
7.7% Benchmark: Fast UK Marketing Budget Allocation with 70/20/10
Start by sizing your total marketing fund using a revenue percentage or CAC-based method, then apply a 70/20/10 split adjusted for your business stage. Gartner’s benchmark puts average marketing spend at 7.7% of company revenue, and the 70/20/10 model gives you a starting point for splitting that fund across proven, strategic and experimental spend. Track your CAC and MER from day one, and review the split every quarter.
TL;DR:
- The ideal marketing budget should be based on revenue percentage or CAC targets, with Gartner’s 7.7% revenue benchmark serving as a reference point.
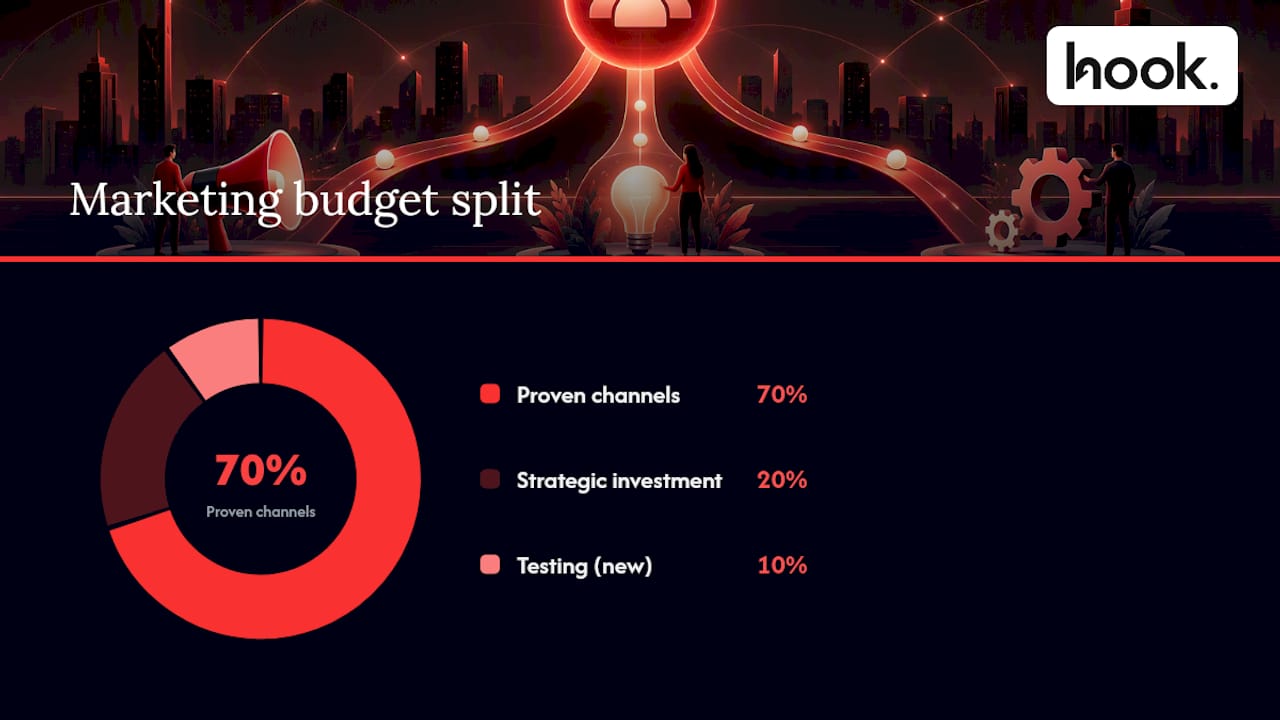
- Most businesses adopt the 70/20/10 split, allocating 70% to proven channels, 20% to strategic efforts, and 10% to testing, adjusting by business stage.
- Tracking CAC, MER, and blended ROAS from day one, with quarterly reviews and incremental reallocations, results in more effective budget management.
- Reallocation rules should be pre-approved and triggered by specific performance thresholds, such as CAC increases or test outcomes, to avoid ad hoc decisions.
- During market entry or product launch phases, accepting higher CAC values is strategic, but efficiency becomes paramount once the business matures and margins are established.
Table of Contents
- Quick rules of thumb and what to act on in the first 30 days
- How to calculate your total marketing budget
- Practical allocation frameworks for splitting your budget
- Sample budget breakdowns you can adapt
- Which metrics to measure and how to test for true incrementality
- Pre-authorised reallocation rules and approval paths
- Frequent pitfalls in allocation and quick fixes
- Operational tips from Hook Digital’s marketing work
- When to prioritise growth over efficiency
- How Hook Digital can help you put this into practice
- Primary sources and templates for further reading
- Sources
- FAQ
Quick rules of thumb and what to act on in the first 30 days
You do not need a perfect budget on day one. You need a defensible starting point, a way to track it, and a plan to adjust it. These five rules cover most of what you will act on immediately.
- Anchor to a benchmark, not a guess. Use Gartner’s 7.7% of revenue as a reference point, then adjust for your growth stage.
- Apply 70/20/10 as your default split. Seventy percent to channels with proven return, 20% to strategic or brand-building work, 10% to testing, as recommended in industry planning templates.
- Hold a contingency reserve. Set aside 5% to 10% of the total budget for reallocation when a channel underperforms or overperforms.
- Reallocate on a schedule, not on impulse. Move 10% to 15% of spend between channels each quarter based on performance data, a pace that top-performing teams use to keep budgets responsive.
- Keep headcount visible. Loaded staff costs and agency retainers belong in the same budget conversation as media spend, not hidden in a separate line.
In week one, pull together actual spend by channel for the last two quarters, including salaries, retainers, tools and media. Set a target CAC based on your average deal value and margin, and write down your MER (marketing efficiency ratio, meaning total revenue divided by total marketing spend). If you need to ask for more budget mid-year, bring evidence: a channel hitting its CAC target with room to scale, or a test that proved incremental lift. Finance teams respond better to a specific payback model than a general appeal for more resources.
How to calculate your total marketing budget
There are three defensible ways to size your total marketing fund, and most businesses end up blending two of them.
The revenue-percentage method is the simplest starting point. Take your projected revenue for the year and apply a percentage based on your stage and sector. Gartner’s 2025 CMO spend survey found average budgets sitting at 7.7% of company revenue, with many organisations reporting that figure feels tight against their goals. The IPA Bellwether report for Q4 2025 found UK marketing budgets broadly flat overall, though categories like PR and events grew while market research and some media spend declined. Newer businesses chasing market share typically sit above the average, while mature businesses focused on profitability sit below it.
The CAC-driven method works backwards from your growth target. Say you want 500 new customers this year and your target CAC is £150: that gives you a media and acquisition budget of £75,000, before you add retention and loyalty spend, which is usually budgeted separately because it serves existing customers rather than new acquisition.
The contribution-margin method checks that your spend is sustainable against what each sale actually earns. A marketing budget that pushes CAC above that figure is burning cash on every sale, so this method acts as a ceiling check on the other two.
| Method | Best for | What it includes | Watch out for |
|---|---|---|---|
| Revenue percentage | Established businesses with stable sales | Percentage of forecast revenue | Ignores acquisition cost trends |
| CAC-driven | Growth-stage businesses with clear targets | Target CAC multiplied by new customer goal | Excludes retention spend by default |
| Contribution margin | Any business checking sustainability | Gross margin per sale versus CAC | Needs accurate margin data to work |
Whichever method sets your headline number, decide upfront whether salaries, agency retainers and software subscriptions sit inside that figure or alongside it. AO Network’s budget template recommends including loaded headcount costs in the same budget as media spend, because that is the only way to see your true cost per acquisition rather than a media-only figure that flatters performance.
Practical allocation frameworks for splitting your budget
Once you know the total, the next decision is how to split it. The 70/20/10 model remains the most widely used starting framework, and for good reason: it is simple to explain to a board and flexible enough to adjust.
- Allocate 70% to proven channels. These are the channels with a track record in your business: the paid search campaigns, email programmes or paid social formats that reliably hit your CAC target.
- Allocate 20% to strategic investment. This covers brand-building activity, content and SEO groundwork, and initiatives with a longer payback but a bigger long-term return.
- Allocate 10% to testing. New channels, new creative formats, new audiences: anything unproven gets a capped, ring-fenced slice so a failed test never threatens the core budget.
Prooflytics’ planning template presents this split as a common 2026 default, with the caveat that stage should shift the balance. A business launching a new product might run 50/30/20, weighting more heavily towards testing and brand-building because it has no proven channel yet. A scale-stage business with a mature funnel might tighten to 80/15/5, since most of its channels are already proven and testing yields diminishing returns.
Mapping channels to funnel stages helps decide which bucket each activity belongs in. Consideration-stage channels like retargeting, comparison content and case studies often straddle proven and strategic depending on maturity. Decision-stage channels such as branded paid search and CRM-triggered offers almost always belong in the proven 70%, since they are closest to the point of purchase and easiest to measure. A broader look at channel types is useful when you are mapping a full channel mix for the first time.
Pro Tip: Write the bucket next to each line item in your budget spreadsheet before you argue about percentages: it forces a conversation about what “proven” actually means in your business.
Recommended stage ranges give you a sense-check once the framework is set. A growth-stage business usually settles closer to the standard 70/20/10 as its marketing channel mix matures.
Use a short checklist to decide where your business sits: do you have enough data yet to call a channel “proven”, or are you still guessing? What is your payback period, and can you afford to wait for it? How volatile has your CAC been over the last two quarters? And how much of your growth depends on brand awareness rather than direct response? Answer those honestly and the right split becomes obvious rather than argued over.
Sample budget breakdowns you can adapt
These splits are starting templates, not fixed rules. Adjust the percentages to your own CAC and margin data before you commit spend.
The heavier weighting towards content and testing reflects the fact that nothing is proven yet.
This mirrors the industry guidance that paid search commonly takes 25 to 35% and paid social 30 to 45% of budget in current templates, with content and CRM holding smaller but strategic shares.
A scale-stage business, optimising an established mix, often settles at paid search 30%, paid social 25%, content and SEO 15%, CRM 15%, events 5%, and tools and testing 10%, with more weight moving into CRM as retention becomes as valuable as acquisition.
| Channel | Launch stage | Growth stage | Scale stage |
|---|---|---|---|
| Paid search | 20% | 30% | 30% |
| Paid social | 25% | 30% | 25% |
| Content & SEO | 20% | 15% | 15% |
| CRM & email | 10% | 10% | 15% |
| Events | 10% | 5% | 5% |
| Tools & testing | 15% | 10% | 10% |
When apportioning headcount and agency fees into these figures, split them by the channels they primarily support rather than lumping them into a single overhead line. A retainer covering paid search and paid social management should be split proportionally between those two channels so your true cost per channel is visible, not hidden behind a generic “agency fees” entry.
- Pace spend quarterly rather than dividing the annual figure by twelve.
- Build in seasonality: retail and B2C businesses often need heavier Q4 weighting, while B2B budgets tend to soften around industry holiday periods.
- Revisit the split at each quarterly review rather than waiting for the annual planning cycle.
Which metrics to measure and how to test for true incrementality
Your allocation decisions are only as good as the metrics behind them. Three numbers matter most: CAC (cost to acquire one customer), MER (total revenue divided by total marketing spend, giving you a blended efficiency view) and blended ROAS (return on ad spend across all paid channels combined, rather than platform by platform). Report all three monthly, and review the trend quarterly alongside your allocation.
- CAC tells you the cost of growth; a rising CAC over consecutive months signals a channel or audience is saturating.
- MER gives you a blended efficiency check that platform-level ROAS cannot, because it captures cross-channel effects that individual platforms miss.
- Blended ROAS is useful for spotting a channel-level trend, but should never be the only number you act on.
Attribution models each carry a bias. Last-click attribution over-credits bottom-of-funnel channels like branded search and retargeting. First-click over-credits top-of-funnel awareness activity. Multi-touch models sit in between but still assume a straight-line customer journey that rarely matches reality. Analytics-focused approaches argue for correcting these biases with a blended view rather than trusting any single model in isolation.
One clear trend in current guidance: platform ROAS can be inflated by attribution overlap, so the most reliable teams pair it with blended MER and incrementality testing before making a reallocation decision.
Incrementality testing answers the question attribution cannot: would this sale have happened anyway? Three simple methods work for most businesses. A geo holdout pauses a channel in selected regions while running it elsewhere, then compares the difference in sales. An on/off test pauses a channel entirely for a fixed period and measures the change in overall conversions, not just the channel’s own reported numbers. A budget-scaling test doubles spend on a channel for two to four weeks to see whether returns hold, decline or improve, revealing whether you are underinvesting or already past the point of diminishing returns.
Run these tests quarterly alongside your reallocation review so decisions are based on evidence rather than platform dashboards alone.
Pre-authorised reallocation rules and approval paths
The businesses that move fastest are the ones that agree the rules before they need them. Set your default review cadence at quarterly, moving to monthly for any channel running an active testing programme, since testing data goes stale faster than steady-state channel performance.
- If cost per acquisition rises 20% for two consecutive weeks, reduce spend on that channel by 15% to 25% and reassess after the next reporting cycle.
- If a channel beats its CAC target by 20% or more for a full month, increase its budget by up to 15%, funded from the contingency reserve rather than another proven channel.
- If an incrementality test shows a channel’s true contribution is materially below its platform-reported return, cut its budget and reallocate to the testing bucket or a stronger performer.
- Keep a contingency reserve of 5% to 10% of total budget, released only against a pre-agreed trigger rather than ad hoc requests.
- AO Network’s guidance notes that a clear contingency and pre-authorised reallocation policy reduces approval friction, because boards approve more reallocation when the rules exist before the request arrives.
- Set an approval matrix by size: moves under 5% of total budget need only marketing lead sign-off, moves of 5% to 15% need finance sign-off, and anything above that needs full leadership approval.
This structure balances speed against oversight. Small, frequent adjustments happen without a meeting; larger shifts still get scrutiny, but the trigger and range are agreed in advance, so the conversation is about confirming the move rather than debating whether to allow it at all.
Frequent pitfalls in allocation and quick fixes
Most allocation mistakes come from habit rather than analysis. Watch for these.
- Using last year’s budget as a floor. Carrying forward last year’s spend by channel assumes nothing has changed, when your CAC, competitive landscape and channel performance all move constantly. Reset the split from your current data each planning cycle.
- Trusting platform ROAS without correction. A channel showing a strong ROAS in its own dashboard may be capturing credit that belongs to another touchpoint. Pair it with blended MER and periodic incrementality tests before scaling spend.
- Cutting content and SEO first under pressure. Content and SEO have a longer payback period than paid channels, which makes them an easy target when budgets tighten, but they are also the hardest to rebuild once cut, as the role of SEO in demand generation shows over a longer horizon. Protect a baseline here even in a lean quarter.
- Raiding the testing budget to cover shortfalls elsewhere. The 10% testing allocation exists to find your next proven channel. Spend it down to patch a shortfall in a proven channel and you lose the pipeline of new growth options for the following year.
Operational tips from Hook Digital’s marketing work
A few practical habits separate a budget that performs from one that quietly leaks money.
- Tighten paid search match types. Broad match without strong negative keyword lists is one of the fastest ways to waste spend; exact and phrase match, backed by a regularly updated negative keyword list, keeps spend pointed at genuine intent rather than loosely related searches.
- Budget realistically for social creative. Paid social pricing in the UK varies widely by production quality and management scope, so ask any agency for a clear breakdown of creative production costs versus ongoing management fees before you commit a monthly figure. Paid social advertising explained for business owners covers the format and budgeting basics in more depth.
- Bring three things to a budget review. A one-page ROI model showing CAC and payback by channel, a 90-day test plan for anything unproven, and a specific contingency ask tied to a named trigger rather than a vague “more budget” request.
Pro Tip: A budget review lands better when the ask is a number tied to a trigger, not a percentage tied to a feeling: “if CPA holds under £120 for 30 days, release the next 10%” beats “we might need more soon”.
Consolidating these decisions with a single team, rather than juggling separate specialists for search, social, content and design, tends to keep the numbers consistent because everyone is working from the same performance data.
When to prioritise growth over efficiency
A lower CAC is not always the right goal. In a market entry, a product launch, or a genuine land-grab moment against competitors, accepting a higher CAC for a period can be the correct call, because the prize is market share that is far more expensive to win back later than it is to fund now.
Efficiency should take priority once you are past that phase: a profitable, established business with a mature funnel has far less to gain from an aggressive CAC and far more to lose from margin erosion.
When you present this trade-off to a board, frame it around payback period and risk controls rather than the raw CAC figure alone. State the expected time to recover the higher acquisition cost, the trigger that would tell you to pull back, and the contingency reserve that protects the rest of the budget if the bet does not pay off on schedule. A board is far more likely to back a higher-CAC growth push when the guardrails are as clear as the ambition.
— Hook
How Hook Digital can help you put this into practice
Sizing a budget is one thing; running it day to day across search, social, content and design is another. That is exactly the gap a full-service marketing agency can help to close: rather than briefing separate specialists for paid media, SEO, branding and video, you work with one team that already knows your numbers.

- Full service marketing covers strategy, paid media and content under one plan, useful if you want a single team owning the whole allocation rather than coordinating several.
- Social Media & PPC management handles the paid search and paid social buckets that typically take the largest share of a growth-stage budget.
- Website Design & Development and SEO & Performance Optimisation support the content and SEO allocation that protects long-term demand generation.
- Branding & Design and Photos & Videos cover the creative production behind your strategic and testing budget, from brand video to product photography.
If you are working through your own allocation and want a second opinion on the split, a short audit of current spend against these frameworks is a practical starting point before committing to a full retainer. Visit the full service marketing page to see how that works in practice.
Primary sources and templates for further reading
The benchmarks and frameworks in this article draw on Gartner’s 2025 CMO spend survey and its 2026 CFO budget priorities release for revenue benchmarks and growth-function priorities, and the IPA Bellwether Q4 2025 report for UK category-level spend trends. The Prooflytics and AO Network templates provide downloadable worksheets for the 70/20/10 split and headcount treatment referenced throughout.
Sources
- Gartner 2025 CMO spend survey — press release
- IPA Bellwether report Q4 2025
- Prooflytics — marketing budget planning template (70/20/10 model)
- AO Network — marketing budget template (2026)
FAQ
What is the 70/20/10 rule in marketing?
The 70/20/10 rule allocates 70% of your marketing budget to proven channels with a track record, 20% to strategic or brand-building investment, and 10% to testing new channels and formats, as described in industry planning templates. Businesses typically adjust the ratio by stage, weighting more heavily towards testing when few channels are proven yet.
What is the 70-10-10-10 budget rule?
It follows the same logic as 70/20/10: protect your proven channels, then split the remaining 30% across longer-term and experimental bets rather than treating it as one block.
What is the 3-3-3 rule for marketing?
Definitions of this rule vary and it is not tied to a single recognised industry benchmark. A common version splits testing cycles into three-week phases for creative, targeting and measurement, though it is used more loosely than the 70/20/10 model covered in this article.
How much budget should be allocated to marketing?
Gartner’s most recent CMO spend survey found average marketing budgets sitting at 7.7% of company revenue, though the right figure depends on your growth stage and CAC targets. Growth-stage businesses chasing market share often sit above that average, while mature, profitability-focused businesses often sit below it.
.png)


